Chapter One, Part C, Executive Computing
Wrapping up Chapter One
Wow! Here we are, still not quite out of Chapter 1 of Executive Computing (“EC”)1. Return with me now to those thrilling days of yesteryear, when there were no bit-mapped graphics and variables were all one letter long. You can check out some of the earlier posts in this series to see what we are doing and why we are here.
In this episode, our hero is trying to make bar graphs and line plots with nothing more than asterisks, a pencil, ruler, and TRS-80 Level II BASIC. Here is his first attempt at a sketch of a BASIC program. He’s just trying to understand the graphics that he wants to produce. As a side note, doesn’t it make life easier to do everything horizontally?! Who knew?
500 REM YEARLY BAR CHARTS
510 '
520     FOR I = 1 TO 4
530         READ Y
540         DATA 15, 18, 19, 21
545         FOR J = 1 TO Y
550             PRINT "*";
560         NEXT J
570         PRINT
580     NEXT I
590 '
800 REM MONTHLY LINE GRAPH
810 '
820     DIM S(12)
830     FOR M = 1 TO 12
840         READ S(M)
850         DATA 14, 20, 22, 24, 26, 15, 16, 20, 26, 23, 19, 17
860         PRINT TAB(S(M));"*"
870     NEXT M
999     END
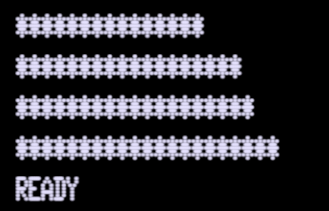
I think these programs were really meant to be sent to a printer, as the output will scroll off the screen. In any case, you get get a (sideways) bar chart of four years of sales data that looks like this:
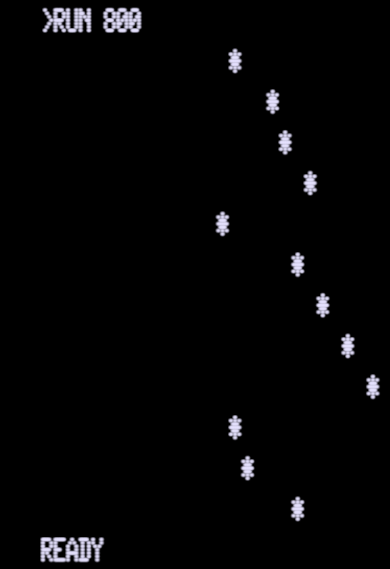
It’s followed by a (sideways) dot plot of the most recent 12 months. The book then instructs the user to join the dots using a pencil and ruler.
Converting this to a reasonable Forth program is straightforward:
create years  15 , 18 , 19 , 21 ,
create months 14 , 20 , 22 , 24 , 26 , 15 , 16 , 20 , 26 , 23 , 19 , 17 ,

: star [char] * emit ;
: stars ( n --) 0 do star loop ;
: .years
    cr  4 0 do years i cells + @ stars cr loop ;
: .months
    cr 12 0 do months i cells + @ spaces star cr loop ;
: scenario .years .months cr ;
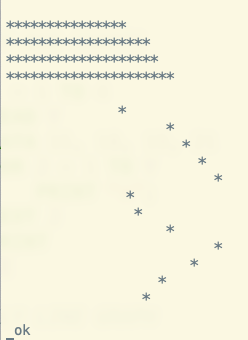
Typing scenario gets us the same output as the BASIC program.
Using real data and making everything look nice
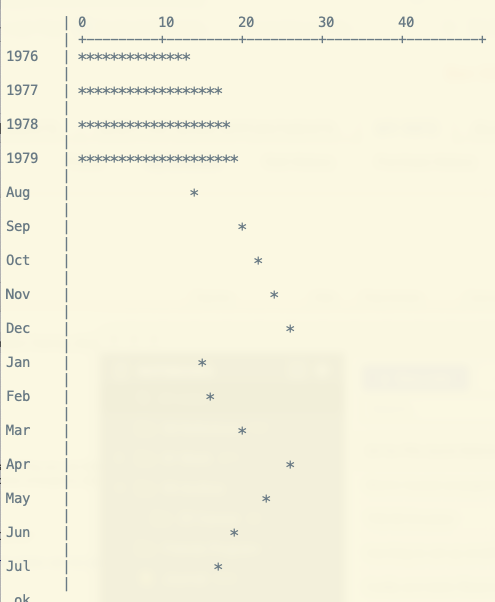
In the book, the scenario is expanded into writing a program that produces a labeled and formatted graph using monthly sales data for the last four years to produce yearly average sales values, along with a line chart of monthly sales for each of the most recent 12 months.
The BASIC program is long enough that I won’t reproduce it in full. It’s on pp. 10-11 of the book, which is available on archive.org. See the link in fn 1. Let’s tackle some of the parts of the problem and then I’ll offer up one solution.
First off, we need three letter month strings for the graph. The snippet below
should work when called with months 0 through 11, as in 2 .month <ENTER> Mar
ok. Natively, everything is zero-based.
Now we are going to import four years of sales data. BASIC uses the READ/DATA
pair for this. We are just going to create one-dimensional arrays. The data
is for years 1976 through 1980, and we only have data for the first 7
months of 1980 (and Jimmy Carter is still president). I am using interspersed
comments to make it easier on the (imaginary) data entry person who would have
to maintain this going forward. Because Forth has two kinds of comments (\
and ()), we can make the data look pretty spreadsheet-like.
Once you get the hang of it, there is something very elegant about create and
the , word for data.
\ cur_month = 1 .. 12, set to July
\ will need to be changed every month before running report
variable cur_month 7 cur_month !

create months 36 allot
s" JanFebMarAprMayJunJulAugSepOctNovDec" months swap move

\ 0-based month picker 0=Jan, 11=Dec
: .month ( n --) 3 * months + 3 type space ;
\ Get month based on sales index number
: ?month ( n --) 12 mod .month ;

create years 1976 , 1977 , 1978 , 1979 , 1980 ,

\ Sales data - months, starting January
\ New data for August, etc. will need to be added before August run

\       Jan  Feb   Mar Apr  May  Jun  Jul  Aug  Sep  Oct  Nov  Dec
create sales
( 1976) 10 , 14 , 16 , 18 , 20 , 16 , 15 , 13 , 11 , 13 , 14 , 15 ,
( 1977) 10 , 15 , 19 , 20 , 21 , 20 , 19 , 15 , 17 , 20 , 22 , 21 ,
( 1978) 12 , 17 , 19 , 23 , 22 , 19 , 18 , 15 , 18 , 20 , 23 , 23 ,
( 1979) 15 , 17 , 21 , 27 , 25 , 20 , 19 , 14 , 20 , 22 , 24 , 26 ,
( 1980) 15 , 16 , 20 , 26 , 23 , 19 , 17 ,

\ average 12 numbers, uses return stack for running total
\ use start month 0, 12, 24, 36 for years 1 .. 4
: yr_avg ( sales start_mon -- avg )
    0 >r dup 12 + swap do dup i cells + @ r> + >r loop drop r> 12 / ;

: border ."   | " ;
: star [char] * emit ;
: stars ( n --) 0 do star loop ;
: .scale 5 spaces border
    ." 0         10        20        30        40" cr ;
: .10 ." +---------" ;
: header
    .scale 5 spaces border 5 0 do .10 loop [char] + emit cr ;
: years_bar
    years 0 cells + @ . border sales 0 yr_avg stars cr
    5 spaces border cr
    years 1 cells + @ . border sales 12 yr_avg stars cr
    5 spaces border cr
    years 2 cells + @ . border sales 24 yr_avg stars cr
    5 spaces border cr
    years 3 cells + @ . border sales 36 yr_avg stars cr
    5 spaces border
    ;

\ Print the last 12 monthly sales figures lookng back from current
\ Would have to be rewritten once year changes
: last12 ( --)
        cr
        \ The 1- and 1+ are because we are trying to
        \ make it easier on the human who thinks July should = 7
        cur_month @ 1- 60 + dup 12 - do
        i 1+ ?month space border
        years i cells + @ spaces star cr
        5 spaces border cr
    loop ;

: scenario cr cr header years_bar last12 ;
And here is the result of the whole exercise:
Conclusion
And we are finally out of chapter 1! Wow. So, remember our goal is to recreate these business BASIC programs in Forth, just to get a sense of whether this would have been doable by a non-geek business type from the 80s. Of course, I’m actually doing this just because it’s fun for me and it provides some structure for my own Forth journey, as well as giving me fresh appreciation for a time when people solved problems with pretty basic tools. Please reach out if you have any thoughts about these little posts.
Next time, we will start Chapter 2: The Long-Range Plan, which sounds hard. Take it easy.
-
Nevison, J. M., (1981). Executive Computing–how to get it done on your own. Addison-Wesley Publishing Company, Inc. https://archive.org/details/executivecomputi00nevi/page/n1/mode/2up ↩